What are $ Indexes?
Though EPDs allow for the comparison of genetic levels for many economically important traits, they only provide a piece of the economic puzzle. That’s where $ Indexes come in. Through well conceived, rigorous mathematical computation, $ Indexes blend EPDs and economics to estimate an animal’s overall impact on your bottom line. The same technology that has led to the dramatic progress in pigs, poultry, and dairy genetics over the last several decades was used to develop our indexes.
What are Australian $ Indexes?
The Australian $ Indexes combine the individual EPDs of economically relevant traits (ERT) in a way that is weighted to reflect our Australian production system, costs of production and payment grids. Two Australian $ Indexes, the Australian Terminal Index (ATI) and the Australian All-Purpose Index (AAPI) have been developed.
Do other industries use economic selection indexes?
Economic selection indexes have been used extensively by the pig, poultry and dairy industries for well over 50 years. The use of indexes that weight the economically relevant traits into a single selection tool has been credited with the vast improvement in production and feed efficiencies in these industries. And of course, Selection Indexes have been used in beef cattle for many years as well.
How were our Australian $ Indexes formulated?
Simmental Australia enlisted the help of world-renowned geneticist Dr Michael MacNeil from Delta G in the USA to help compose our Australian $ Indexes. The Technical subcommittee of the board worked with Dr MacNeil over a period of 6 months to refine the two $ Indexes that best represent the economic values of our Australian production system.
Data on the Australian cattle population, production systems and input costs were sourced from our State Departments of Agriculture as well as MLA. Information was also inputted from the major meat processing plants as to payment structure and long-term prices.
This data was entered into a purpose built, computer model that effectively simulates the “average” farming year here in Australia. The economic values were determined by “asking” the model the amount simulated profit changes when each of the Economically Relevant Traits (ERT’s) was changed by a single unit. For some ERT there is no directly corresponding EPD. To account for these ERT, index values were calculated for the genetically correlated EPD. This has resulted in the Australian $ Indexes, ATI (Australian Terminal Index) and AAPI (Australian All-Purpose Index).
Are the Australian $ Indexes made to favour one Simmental Type over another?
The Australian $ Index doesn’t consider breed or type. It is just a way of combining the trait predictions that are generated by IGS into a single economically relevant number. The Australian $ Indexes rely on the accuracy of the component traits generated by IGS, but the way those traits are combined is not at all biased by breed type. The Australian $ Indexes are calculated on the Economically Relevant Trait weightings, irrespective of breed type.
Was there any adjustment made to Economically Relevant Trait weightings in the Australian $ Indexes?
Yes, two small alterations were made. The first was to include a very small increase in the weighting for IMF (Marbling). Marbling score has no economic importance in almost all Australian payment systems. The board did recognise however that there are some markets in Australia where marbling is important and decided to include this trait with a slight positive emphasis.
The other trait that was included on an ad hoc basis was docility. The board believes it is important to keep the breed’s image of being “docile cattle” at the forefront of breeder’s minds, so docility was included in the indexes based on other research that Dr MacNeil has conducted. However, both these traits have a relatively small impact on an animal overall Australian $ Indexes.
What are the key differences between our Australian $ Indexes and the ones we traditionally used through Breedplan?
There are two main differences between our traditional Breedplan Indexes and our new Australian $ Indexes. The first one is obvious, in that Breedplan Indexes were made using Breedplan EBV Traits and the new Australian $ Indexes are calculated from IGS EPDs.
The second major difference is the point at which the value of an animal is measured. Breedplan Indexes measured the value of a sale animal at either its 200, 400 or 600 day liveweight. There was a correction made in all indexes for Saleable Meat Yield (not carcase weight), but it was calculated using “best estimate” rather than from a strict modelling approach. The new Australian $ Indexes use Carcase Weight EPD as the measurable end point.
There are two main benefits of using the Carcase weight EPD like this. Firstly, it aligns with the value of the carcase at the end of the production system which is one of the key places where we want to build value for the Simmental Brand (think of what the Angus and Wagyu breeds have done in this space).
The second is, the Australian $ Indexes hold relatively stable over a range of carcase weight end points. In other words, it is a relatively good predictor of economic outcome over a wide variety of markets from the 12-month-old 300kg carcase, trade steer in Western Australia to the 36 month-old 400kg carcase, Jap Ox in Queensland. As such we don’t have the same need, under this system, to have separate indexes for vealer, trade finished cattle and export Jap Ox.
What are the key differences between the Australian $ Indexes and API and TI from IGS?
The main difference between the IGS generated API and TI and the Australian $ Indexes (AAPI and ATI) are that the new indexes are formulated for economic importance under our Australian production systems, given our cost base and payment grids. Practically what that means is there is a considerable decrease in the relative weighting of Marbling Score and Yield grade. These traits are very important in the American market where all carcases are sold over a “Yield and Grade” grid, but not very relevant to our payment system.
There is also a decrease in the weighting on calving ease direct, because it was found to be less of an economically important trait when our production system and cow data was put into the model.
The Australian Indexes also include a modest weighting for the docility trait.
Our two new Australian $ Indexes are more closely correlated to each other than they are to their respective IGS equivalents. In other words, an animal’s ranking on the Australian Terminal Index (ATI) is more closely linked to its ranking on Australian All-Purpose Index (AAPI) than ATI is to the IGS TI or AAPI is to IGS API.
This was not a deliberate decision. The data was put into the model and the indexes are what came out. They are objective measures rather than subjective ones. What it does do though, is highlight just how different the economics of production are between the Australian and the American systems.
What traits were used to develop the Australian Terminal Index (ATI)
For the ATI, the model used Simmental bulls over a reference population of British crossbred cows with all the resulting animals sold for slaughter.
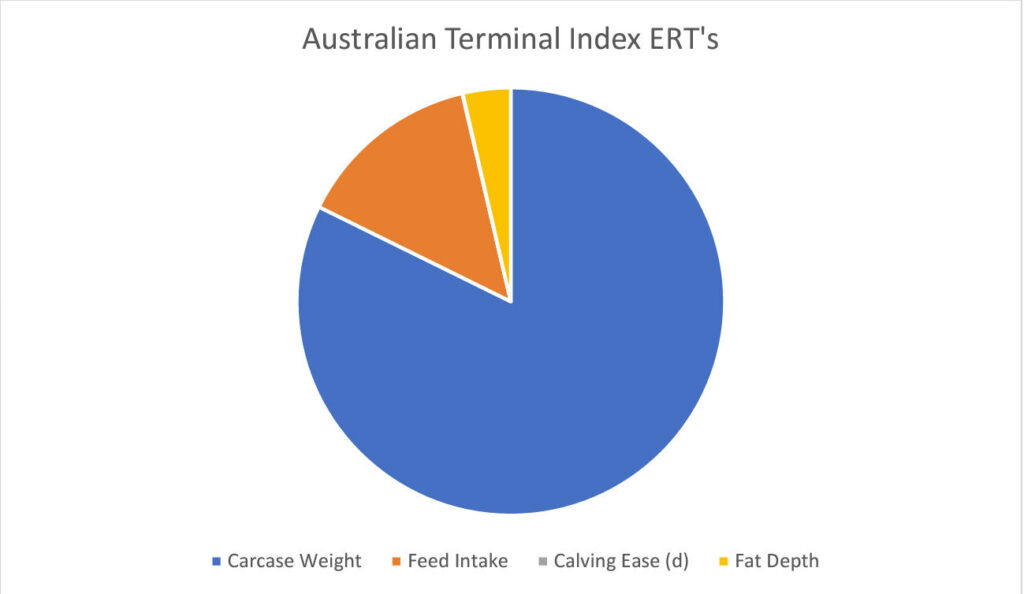
The model found that the most economically relevant traits (those that drive income and expenses) were carcase weight, post weaning feed intake, calving ease and fat depth with the first two being the primary drivers of importance. In other words, the model found the two biggest drivers of profit in our Australian terminal system were carcase weight and how much feed the animal ate before being processed.
The EPDs used in the index were Carcase Weight, weaning weight direct and post weaning growth (as indicators of post weaning feed intake), Calving Ease Direct, fat depth with marbling and docility included in small amounts as mentioned above.
What traits were used to develop the Australian All-Purpose Index (AAPI)?
For the AAPI, the population of reference is characterized by using Simmental and Angus sires to produce two breed rotation females with a portion of these rotational cross females bred to a terminal sire of a third breed. All the male offspring from the rotational cross segment of the production system and their female counterparts that were not needed as replacements were sold for slaughter. In addition, all the offspring from the terminal sire breed were slaughtered.
The economically relevant traits (those traits that drive income and expense) for the calculation of this index were cow weight, milk, fat depth, calving ease (direct), calving ease (maternal), stayability, feed consumed by the cow herd and postweaning by the calves that were produced, and carcass weight.
EPDs that were included in the index were: calving ease (direct) and calving ease (maternal), weaning weight (direct), weaning weight (maternal) and postweaning gain (as indicators of feed intake of the cow and calf respectively), stayability, carcass weight and fat depth; with stayability, carcass weight, and the feed intake traits being the most important economically relevant traits.
As with the Australian Terminal Index a small weighting above their strict economic relevance has been added for both Docility and Marbling.
Why do the Australian $ Indexes only use British breed base cows?
There are a few reasons we have not, at this stage, developed Bos Indicus cow based models. The first is that particularly in the case of the ATI (Australian Terminal Index) cow choice is unlikely to have any significantly difference on the outcome. Cow choice does impact calving ease pressure, but our ATI model showed that even with British cross bred cows, calving ease direct has only a small economic impact on the index. As such, because calving ease is included as such a low level in the ATI, moving the calving ease of the base herd a little, was unlikely to change the index significantly.
Another important factor in the decision, is that the data required to formulate the index for an Australian Bos Indicus base herd is not readily available. It is expected that in addition to calving ease, changing the reference population to a Bos Indicus base would most likely change the weighting around cow feed input costs but those are difficult to quantify (but not impossible).
The model also requires a specific “farming system” to be put in place. It would be difficult to arrive at just one system for the Bos Indicus model. For instance, would the system be a simple two-way rotational cross using both Brahman and Simmental bulls with “Simbrah F1’s” retained as replacements or would it be a criss cross with Charolais and Shorthorn bulls, with each system potentially requiring its own model and $ Index.
The final reason for not pursuing Bos Indicus based $ Indexes now is that, in the opinion of Dr MacNeil, we are not likely to see major differences in the way animals rank. He has developed Bos Indicus female-based indexes for breed societies in the past. These indexes have been abandoned after being used for some time because they did not significantly change the ranking of candidates for selection. Also, development of more indexes does significantly add to the cost.
Having said that though, it is something the Board has not ruled out doing in the future if the need exists and we can get over the other hurdles. How should we use the Australian $ Indexes as a selection tool? The Australian $Indexes are designed to be the primary ranking of animals for economic performance. Of course, they do not consider phenotypical structure, colour, “type”, “breed character” or “faults. They are however an unbiased assessment of the economic value of the animals. Simmental Australia suggests that the new Australian $ Indexes be given strong selection consideration if we are to advance the economics of running Simmental Cattle in Australia.
How do I use Australian $Indexes in the best way for my business?
First, determine which index to use; if your clients are keeping replacements from your bulls use AAPI, if not, use ATI. Then, just as with EPDs, concentrate on the unit difference between bulls. The difference can be used to determine how much a bull is worth compared to another.
Our Australian $ Indexes are expressed in $ difference per cow exposed, after costs are taken out. For instance, if using ATI, you can determine a bull at ATI of $70 is worth $6,000 more than a bull of $20 (If exposed to 30 cows/year for 4 years, $50 x 30 x 4 = $6,000). Obviously, this is the increased value to the end user. If a stud breeder is selecting a sire to be retained, then the economics of using higher $ Index bulls is significantly magnified by the increased value of the progeny produced.
But I sell my calves at weaning, so shouldn’t I use weaning weight to predict the value of a bull?
The weaning weight EPD will predict the difference in weaning weight of the bull’s calves, but it doesn’t consider how much additional feed the calf or cow has eaten or any potential increase in calving difficulty associated with calves that go on to be heavier weaners. The Australian $ Indexes are a better selection tool for this in general and also take into account the value of the carcase at the end of the production chain.
However, if you do have reason for putting additional selection pressure in one area, you can combine the Australian $ Index with the relevant EPD of concern. For instance, if you sell your calves as weaners then you might look at the top 5 sires on ATI and then choose the one from that group that has the greatest weaning weight EPD. The same process can be followed for other traits like wanting to increase milk in the female herd. What weightings did the model produce for the individual Economic Relevant Traits? The following pie graphs give an indication of the weightings that were assigned to the individual Economic Relevant traits under the Australian production, cost and payment systems.